Fahrenheit 451 Character Analysis (English 12 Dystopia Study)
Learning outcome: Recognize and identify personal, social, and cultural contexts, values, and perspectives in texts, including gender, sexual orientation, and socio-economic factors (BC Curriculum)
Task:
- Create an infographic on Canva analyzing one of the characters from Fahrenheit 451 (Clarisse, Montag or Beatty).
- You must incorporate quotes and explain how they are said and their relevance.
- You must provide evidence of how the character is viewed by others
- Include details from the novel, the 1966 movie and the 2018 movie
- Evaluate yourself on the rubric provided
- Submit your assignment in the Canva Team and your rubric in Teams
Exemplar: Faber Character Analysis
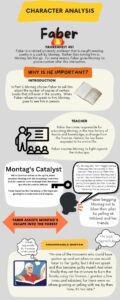
Infographic example of a character analysis of Faber from the novel Fahrenheit 451.
How to use Canva
- Go to canva.com
- Create your account using your SD 58 e-mail address
- Accept Ms. Mounce’s Team invite
- Select “Infographic” and begin
Rubric
| Student Evaluation | Criteria | Teacher Evaluation |
|
EMER DEV PRF EXT |
I can provide concrete details, quotations and examples
|
EMER DEV PRF EXT |
|
EMER DEV PRF EXT |
I can draw evidence from literary and visual text to support my claims
|
EMER DEV PRF EXT |
|
EMER DEV PRF EXT |
I can incorporate quotations with appropriate context
|
EMER DEV PRF EXT |
|
EMER DEV PRF EXT |
I can provide sufficient evidence about what a character says and how they say it
|
EMER DEV PRF EXT |
|
EMER DEV PRF EXT |
I can accurately describe how others see and respond to the character
|
EMER DEV PRF EXT |
|
EMER DEV PRF EXT |
I can define the conflicts faced by the character
|
EMER DEV PRF EXT |
|
EMER DEV PRF EXT |
I can present work that follows the conventions of spelling and grammar
|
EMER DEV PRF EXT |
Relevant Readings and Theories
Following the ITPC, I wanted to ensure that the images did not create a distraction from the written information, but supported it. I also wanted to have the infographic fall under the representational view rather than decorative because this is a major project for the course, not just a filler. Vogelsinger (2014), asked guiding questions for those creating infographics and I attempted to follow them. Engagement with the infographic is triggered by the animated fire as well as a clear title. All pertinent information is placed within the white spaces with a high-contrast coloured font to draw the eye to it and maintain focus. Headings are larger than explanations so information is easier to find. My infographic begins with general information and steadily becomes more specific, hopefully creating a flow. Dunlop & Lowenthal (2016) provided guidelines for effective infographics, which I also attempted to follow: immediacy and coherence specifically.
References
Dunlap, J. C. & Lowenthal, P. R. (2016, September 8). Getting graphic about infographics: Design lessons learned from popular infographics. Journal of Visual Literacy, 35(1), 42–59.
https://doi.org/10.1080/1051144X.2016.1205832
Schnotz, W. (2022). Integrated Model of Text and Picture Comprehension. In R.E. Mayer & L. Fiorella (Eds.), The Cambridge Handbook of Multimedia Learning (pp. 82-99). Cambridge University Press.
https://www-cambridge-org.ezproxy.tru.ca/core/books/cambridge-handbook-of-multimedia-learning/integrated-model-of-text-and-picture-comprehension/984E5EBEFF5D53F5DD8BDA62F6A60718
Vogelsinger, B. (2014, July 16). Inventing infographics: Visual literacy meets written content. Edutopia.
https://www.edutopia.org/blog/infographics-visual-literacy-written-content-brett-vogelsinger
March 1, 2023 at 3:43 pm
I love that you have students evaluate their own performance on the same rubric used by the instructor. It can be helpful to know their expectations when you provide feedback.
March 4, 2023 at 1:04 pm
Thanks Karine, I have found a fair amount of success with this and it helps some students feel more confident about their assignments.